
Published: 9 June 2026 | Last data refresh: June 2026 (SGS 10-year yield as at mid-May 2026; DBS, OCBC, and UOB FY2025 and Q1 2026 results as published)
One macro number actually enters every valuation model. Not GDP growth. Not the Federal Reserve’s dot plot. Not the outcome of the next MAS monetary policy review. Those headlines matter only insofar as they eventually move a single input: the risk-free rate. From that rate, a cost of equity is derived; from the cost of equity, every dividend discount model, every discounted cash flow, every Justified price-to-book multiple is built. Getting that one number right — and keeping it consistent across every company I value — matters more than precision on any company-specific assumption.
This piece is the reference for how I set that rate in Singapore: what it is, where it comes from, why MAS policy does not directly control it, and why SORA is not the risk-free rate for discounting equity cash flows. Two worked exhibits using DBS Group Holdings (SGX: D05) show exactly how much a 110-basis-point error in Rf moved the implied ROE and the forward fair value. The error was mine, published, and corrected. The plumbing behind it is what this piece is about.
Why This Matters Now
In April 2026, MAS tightened monetary policy — increasing the rate of appreciation of the S$NEER band, its primary monetary policy instrument. By headline logic, that sounds like higher discount rates: central bank tightens, cost of capital rises.
SGD interest rates fell anyway. The SGS 10-year yield, which sat near 2.60% in early 2025, was trading around 2.10% by mid-May 2026 and had touched a trough of approximately 1.74% in late 2025. Federal Reserve cuts and broad moderation in long-end yields pulled SGD rates down faster than any domestic signal moved them.
If you were running DBS through a dividend discount model with Rf = 3.2% — a figure still circulating in older rate summaries before the cycle turned — you were discounting 110 basis points above where the market was actually pricing long-dated government risk. That error is the difference between a Gordon Growth base-case fair value of approximately S$53 and approximately S$69, and in the reverse P/B framework, the difference between reading the market as pricing modest ROE compression versus pricing a near-decade-low long-run ROE.
The April 2026 episode is a clean illustration of why “MAS tightened” does not translate into “higher discount rate.” Understanding that disconnect requires understanding the plumbing.
The One Number That Moves Everything
The risk-free rate enters a bank valuation in three places.
The first is the cost of equity (Ke — the return an equity investor requires to hold the stock):
Ke = Rf + β × ERP
What you would earn risk-free, plus a premium scaled by the stock’s systematic risk (β, beta) and the equity risk premium (ERP — the extra return investors demand over government bonds). Move Rf by 1 percentage point and Ke moves 1 percentage point in lockstep.
The second is the DDM fair value. In the Gordon Growth formulation:
Fair value = D₁ / (Ke − g)
A growing stream of dividends, divided by the gap between what investors demand and how fast the dividend is expected to grow permanently (g). As Ke falls toward g, the denominator shrinks toward zero and fair value accelerates upward — that is the convexity, and I will return to it in the forward fair value exhibit below.
The third is the Justified P/B (the price-to-book multiple internally consistent with the stock’s fundamentals):
Justified P/B = (ROE − g) / (Ke − g)
The market weighing the returns a bank generates (ROE — return on equity: annual net profit as a percentage of book equity) against what investors demand (Ke), net of growth. Run this in reverse — observe the market P/B and back-solve — and you get a direct read on the long-run ROE already embedded in the price.
For industrial companies, Rf enters through the WACC and compounds into the terminal value, which often accounts for 60–80% of the calculated intrinsic value. The WACC mechanics are covered in How to Value a Manufacturing Company.
The two exhibits in this piece behave differently. The reverse P/B relationship is linear: the P/B multiple acts as a constant slope, and each 1-percentage-point change in Rf shifts the implied ROE by a fixed amount. The forward DDM fair value is convex: the sensitivity of fair value to Rf increases as Rf falls. Getting the shape right matters.
The Singapore Plumbing
What Rf actually is
In Singapore valuation, the risk-free rate is the yield on the SGS 10-year government bond — Singapore Government Securities (SGS) at the ten-year tenor.
Why ten years? Duration matching. Equity is a long-duration asset: in a going-concern model, cash flows extend into perpetuity. The ten-year is the longest liquid tenor on the SGS curve and the market convention for equity discount rates globally. Shorter tenors — the SGS 5-year, or the 3-month T-bill — mismatch the duration of the asset being valued.
SGS are obligations of the Singapore government, rated AAA/Aaa — as close to riskless as a SGD-denominated instrument gets. The SGS 10-year yield as at mid-May 2026 was approximately 2.10%, locked across all three published bank valuations on this site. Singapore Savings Bonds (SSBs) are non-tradeable retail instruments; they are not the benchmark for an equity discount rate.
SORA is not your Rf — but it is in your model
This is the nuance most likely to trip up a reader who has been watching SGD interest rates fall and drawing the wrong inference.
SORA — the Singapore Overnight Rate Average — is the overnight benchmark rate in the Singapore interbank market, administered by MAS. As at Q1 2026, SORA averaged approximately 1.07%.
SORA governs a company’s near-term interest expense. A corporate loan priced at 3M SORA + 1.2% will see its interest cost fall when SORA falls. A listed company’s floating-rate term loan may reference SORA directly. When SORA falls, cash interest expense falls — and this flows through on the cash-flow side of the model: lower Kd, lower near-term WACC, or, for a bank, directly into NIM (net interest margin — the spread between the yield on interest-bearing assets and the cost of interest-bearing liabilities, as a percentage of those assets).
The SGS 10-year yield governs the discount rate — the rate used to discount long-duration equity cash flows. This is the equity side: Ke, and by extension WACC, DDM fair value, and Justified P/B.
SORA manages near-term cash-flow interest expense; the SGS 10Y dictates long-term equity discounting. Two ends of the same government’s curve, doing two different jobs.
The practical mistake: a reader who watches mortgage rates fall as SORA declines and assumes the valuation discount rate has collapsed in lockstep has mixed up the two ends of the curve. SORA’s decline eases near-term interest expense — it enters the model on the cash-flow side. The equity discount rate only moves when the SGS 10-year moves. In Q1 2026, SORA averaged approximately 1.07% and the SGS 10-year sat near 2.0% — roughly a full percentage point apart. Use SORA as Rf and you understate Ke by approximately that margin, with a material impact on DDM fair value.
MAS targets the currency, not the rate
MAS does not set an interest rate target the way the Federal Reserve sets the fed funds rate. MAS manages the value of the Singapore dollar by adjusting the slope, width, and mid-point of the S$NEER band — the currency, not the rate.
SGD interest rates are substantially imported. When the global rate environment shifts — Federal Reserve cuts, compression in 10-year US Treasury yields — Singapore government bond yields move in sympathy through interest parity:
“If global investors expect the Singapore dollar to strengthen by about 1% a year against the US dollar, Singapore bonds can pay roughly 1% less interest than US Treasuries and still hand a global fund manager the same total return.”
When a MAS tightening headline appears, the first question is not “did discount rates rise?” but “what did the SGS 10-year actually do?” If the global rate environment was simultaneously easing — as it was in 2025 and into 2026 — SGD yields could fall regardless of what MAS did to the currency band. In April 2026, that is exactly what happened.
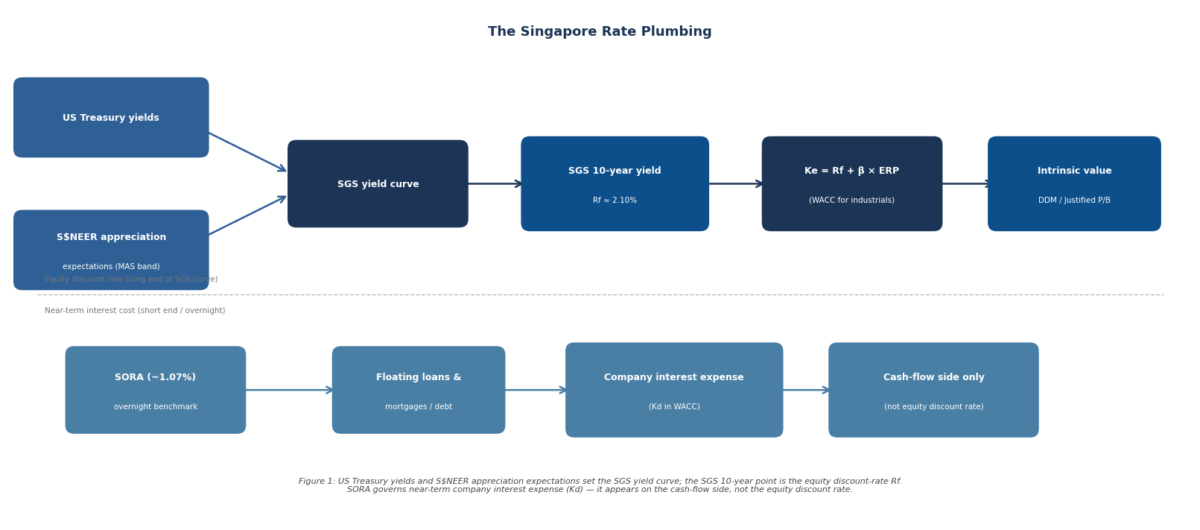
The chain
US Treasury yields and S$NEER appreciation expectations jointly shape the SGS yield curve → the SGS 10-year is the equity discount-rate Rf → Ke and WACC follow → intrinsic value. In parallel, SORA governs near-term company interest expense (Kd), flowing through the cash-flow side of a WACC or directly into a bank’s NIM. The two flows do not move in lockstep, and putting SORA on the wrong side of the model is the error that cost me 110 basis points.
The Discipline: Consistency Beats Precision
“The macro variable worth obsessing over isn’t the headline you can’t forecast — it’s the one number already sitting in your denominator.”
The discipline: lock Rf = 2.10% (SGS 10-year, mid-May 2026) and g = 2.5% across every Singapore bank valuation until one of three conditions is met. Beta is the only company-specific dial.
The payoff is a peer comparison that is analytically meaningful. When every company in the peer group uses the same macro inputs, the spread in market-implied ROE is a clean signal — a direct read on how the market differentiates between franchises — rather than an artefact of three inconsistent discount rates.
| Bank | β | Premium (β × 5.0%) | Ke | Market-implied long-run ROE |
|---|---|---|---|---|
| DBS (D05) | 0.85 | 4.25% | 6.35% | 11.9% |
| OCBC (O39) | 0.95 | 4.75% | 6.85% | 9.95% |
| UOB (U11) | 0.90 | 4.50% | 6.60% | 7.63% |
Rf = 2.10%, g = 2.5%, ERP = 5.0% held constant across all three. Beta is the only company-specific input.
The 11.9 / 9.95 / 7.63 spread is the market’s relative assessment of each franchise’s long-run earning power, readable precisely because the macro footing is identical. DBS commands the highest implied ROE, consistent with its premium multiple and FY2025 ROE of 16.2%. UOB at 7.63% sits well below its five-year average — a story developed in the UOB June 2026 analysis. None of that differentiation is analytically meaningful if the three cost-of-equity estimates rest on three different Rf assumptions.
Show the Math: How One Wrong Rf Flips a Conclusion
My original DBS article used Rf = 3.2%; the correct figure was 2.10%. The DBS correction note published 15 May 2026 documents the full impact. The two exhibits below use the locked figures from that correction.
Exhibit A — The reverse P/B lens (linear in Rf)
Formula: implied ROE = P/B × (Ke − g) + g — in plain English, the long-run ROE the market is implicitly pricing in, given the observed price-to-book multiple, the cost of equity, and the assumed long-run growth rate.
| Rf (SGS 10Y) | Ke | Implied long-run ROE | The read |
|---|---|---|---|
| ~1.74% (late-2025 trough) | 5.99% | ~11.0% | Far below recent 16–17% and the 15–17% guidance — deep pessimism |
| ~2.10% (current / locked) | 6.35% | 11.9% | Well below guidance and recent delivery — market pricing meaningful ROE compression |
| ~2.50% | 6.75% | ~12.9% | Still below guidance; milder pessimism |
| ~3.20% (the original error) | 7.45% | 14.6% | Just below the 15% floor — looked like “quality at fair price” (the wrong conclusion) |
DBS P/B = 2.45; FY2025 ROE 16.2%, Q1 2026 ROE 17.0% annualised; management guidance 15–17%.
The original error produced an implied ROE of 14.6% — just shy of management’s 15% lower guidance bound — and I read the market as pricing “quality at fair price.” The corrected implied ROE is 11.9%, well below guidance and recent performance. The correct read: the market is pricing meaningful ROE compression; the bull case depends on whether the wealth management pivot can disprove that. One wrong macro input moved the implied ROE by approximately 2.7 percentage points and reversed the conclusion.
The relationship is linear: each 1-percentage-point change in Rf shifts the implied ROE by approximately 2.45 percentage points — the P/B multiple acting as the slope. No curvature. The verdict flip is steep but proportional.
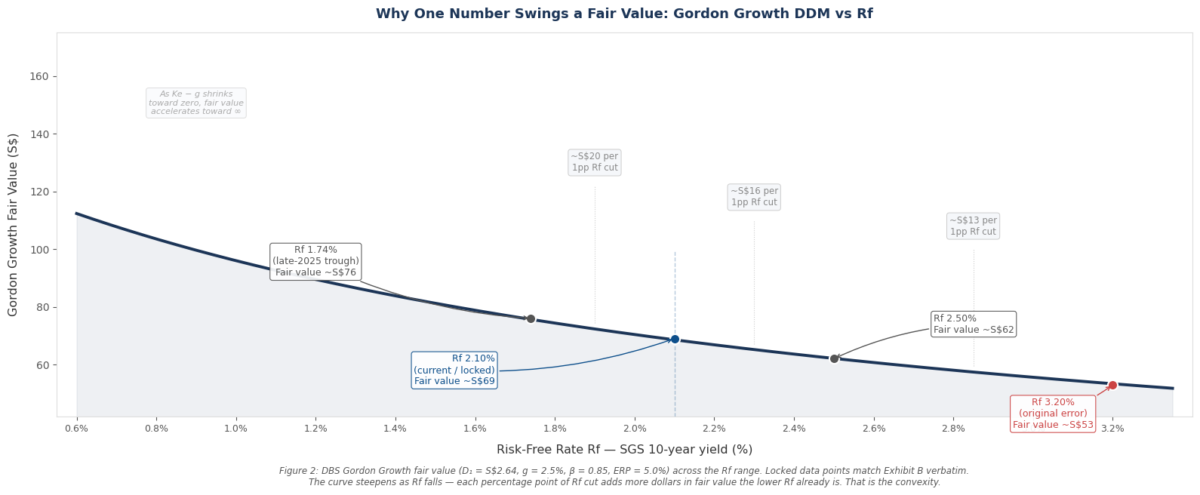
Exhibit B — The forward fair value lens (convex in Rf)
Formula: Fair value = D₁ / (Ke − g) — a growing dividend stream divided by the gap between the required return and the growth rate. The mathematical shape is different here.
| Rf (SGS 10Y) | Ke | Ke − g | Fair value | Marginal sensitivity (S$ per 1pp Rf cut) |
|---|---|---|---|---|
| ~3.20% (error) | 7.45% | 4.95% | ~S$53 | — |
| ~2.50% | 6.75% | 4.25% | ~S$62 | ~S$13/pp |
| ~2.10% (locked) | 6.35% | 3.85% | ~S$69 | ~S$16/pp |
| ~1.74% (trough) | 5.99% | 3.49% | ~S$76 | ~S$20/pp |
D₁ = S$2.64, g = 2.5%. Reference price ~S$60 at time of original analysis.
Note: the row intervals are not uniform 1pp steps — the gaps are 0.70pp, 0.40pp, and 0.36pp respectively. The right column shows the normalised marginal sensitivity at each Rf level: the dollar gain per full percentage point of Rf reduction derived from the Gordon Growth curve at that point, not the absolute fair-value jump between adjacent rows.
The same 1 percentage-point cut in Rf adds more dollars in fair value the lower Rf already is. That is the convexity of the Gordon Growth formula: as (Ke − g) narrows, small movements in Ke produce progressively larger movements in fair value. At Rf = 3.20%, a 1pp cut adds approximately S$13; at the locked Rf of 2.10%, the same cut adds approximately S$16; at the 1.74% trough, approximately S$20. The estimate becomes increasingly fragile — in both directions — as the spread between Ke and g thins.
The lesson is not that Rf should be as low as possible. It is that anchoring the macro input honestly is the single most important thing you can do to stabilise the output.
Risks: What Would Change How I Set Rf
I hold Rf = 2.10% against three pre-committed conditions for revision.
The first is a sustained level move: if the SGS 10-year rises above 3.0% and holds there for more than two consecutive quarters, I would revise upward. A temporary spike from a single auction does not qualify; the rate would need to settle at a new level.
The second is a currency denomination mismatch: if I were valuing a company with primarily USD-denominated cash flows — one for which the SGS 10-year is genuinely the wrong benchmark — I would use the US Treasury 10-year yield and USD parameters throughout. The cash flows and the discount rate must be denominated in the same currency.
The third is curve inversion: if the SGS 2-year yield exceeds the SGS 10-year yield by more than 50 basis points and holds that inversion for a full quarter, I would revisit whether the 10-year point remains the appropriate anchor.
These conditions are pre-committed rather than judged case by case, because the value of a consistent Rf lies precisely in its resistance to motivated reasoning. The temptation when a low Rf produces a high fair value is to hold the Rf unchanged. The discipline requires that only a pre-defined objective condition changes it.
Closing Thought
The risk-free rate will not tell you whether DBS can sustain ROE above 15% through the next rate cycle, or whether UOB’s ASEAN expansion will deliver the earnings uplift the buyback programme implies. Those are company-specific questions deserving most of the analytical attention. What Rf does is set the foundation honestly — and an honest foundation means the company-specific signal you are reading is genuinely a company-specific signal, not a noise artefact of a mismatched discount rate.
The cross-bank framework that relies on this Rf is in the Singapore Bank Metrics Cheat Sheet. The bear case discipline that first surfaced the error is in The Bear Case Habit.
Disclosure: At time of writing, the author holds 1,100 units of Oversea-Chinese Banking Corporation Ltd (SGX: O39) and 100 units of United Overseas Bank (SGX: U11). The author holds no position in DBS Group Holdings (SGX: D05) and has no plans to initiate any such position within the next 72 hours. All three banks are referenced in this article solely as worked examples of the risk-free rate framework discussed — not as recommendations. No view is expressed on whether any of the three is a buy, hold, or sell at current prices.
Disclaimer: This article reflects the author’s personal analysis and opinions, written in a strictly personal capacity. It is not financial advice and does not take into account any individual reader’s financial situation, investment objectives, or risk tolerance. Information is sourced from publicly available filings as of the date noted but accuracy cannot be guaranteed. The author may hold positions in securities discussed (see disclosure above). Readers should conduct their own research and consider consulting a licensed financial adviser before making any investment decisions. The author is not a licensed financial adviser under the Financial Advisers Act of Singapore.
An ordinary man with extraordinary inspiration