
Worked example based on Frencken Group’s FY2025 Annual Report. Figures match the published Frencken valuation (13 May 2026); they are illustrative of method, not a current call.
A DCF gives you a number, and the number feels like an answer. It usually isn’t. For a cyclical, working-capital-intensive manufacturer, the honest question is not “what is it worth” but “what is the market already assuming.” This piece walks through the toolkit I use for industrial and manufacturing names — free cash flow, WACC, terminal growth, and the base-case DCF — and then flips it into a reverse DCF, which I argue is the more useful of the two. The base case tells you what you believe. The reverse DCF tells you what the price requires, and lets you check that against the company’s actual history rather than your own optimism. Frencken Group (SGX: E28) is the worked example throughout.
Why a single DCF number misleads, and why this matters for manufacturers
A DCF — discounted cash flow — converts all the cash a business is expected to generate in the future into today’s money. The process is standard and the formula is clean. The problem is not the method; it is the fragility of its inputs when applied to a manufacturer.
Three structural features make the headline DCF figure particularly unstable for industrial companies. First, cyclicality: revenue and margins move through multi-year demand cycles, and a single run-rate assumption bakes in the current point of the cycle without knowing it. Second, working-capital intensity: manufacturers tie up significant cash in inventory and receivables before revenue arrives, so free cash flow can diverge sharply from profit even in a healthy year. Third, terminal-value dominance: in most DCFs for stable industrials, 70–80% of the modelled value comes from a single long-run growth assumption at the tail of the forecast, making the headline number extraordinarily sensitive to a figure nobody can know.
These features compound. A manufacturing DCF built at the top of a cycle with an optimistic terminal growth rate looks precise and is, in practice, doing most of its work on an assumption about the economy in 2040. This is why I treat the SGX annual report as the indispensable starting point: input quality matters as much as model architecture.
Frencken is the worked example here — precision engineering, meaningful cyclicality, a net-cash balance sheet, and a fully published model in the Frencken valuation piece.
Free cash flow: what you are actually discounting
The thing being discounted in a DCF is not earnings — it is free cash flow. Specifically, for an industrial company, I work with FCFF — free cash flow to the firm — which is the cash the business generates for all capital providers (debt and equity holders) before any financing activity. The build is:
FCFF = NOPAT + D&A − Capex − Increase in NWC
Each line matters. NOPAT — net operating profit after tax, calculated as EBIT × (1 − tax rate) — is the operating profit adjusted for tax but before interest, which isolates the operating business regardless of how it is funded. Adding back D&A (depreciation and amortisation) converts from accounting profit to cash, since D&A is a non-cash charge. Subtracting capex accounts for the cash actually spent maintaining and expanding the asset base. Subtracting the increase in NWC — net working capital, the difference between current operating assets (inventory, receivables) and current operating liabilities (payables) — captures the cash tied up as the business grows.
FCFE — free cash flow to equity, the shareholders’ slice — is preferred for leveraged or financial companies; for a net-cash industrial like Frencken, the two converge and FCFF’s enterprise-value bridge keeps the arithmetic cleaner.
The NWC trap
The working-capital line is where manufacturers most reliably mislead investors accustomed to reading consumer or software financials. For a high-mix, precision-engineering manufacturer, inventory and receivables scale roughly proportionally with revenue. Frencken’s NWC intensity in a growth year runs approximately 15–20% of incremental revenue — meaning every S$100m of new revenue requires roughly S$15–20m of cash consumed before any of it becomes free cash flow.
The counterintuitive corollary: strong operating cash flow can be a symptom of contracting orders, not operational excellence. When demand falls, manufacturers draw down inventory rather than replenish it, releasing cash in the process. In Frencken’s FY2025 results, operating cash flow looked exceptionally strong partly because inventory fell S$28.0m, which management attributed to a slowdown in European orders. That is the mirror image of growth. An investor who extrapolates FY2025 operating cash flow as the new normal has misread the signal.
The J-curve
Manufacturers spend capex years before the revenue it serves arrives. Frencken’s S$63m Singapore cleanroom expansion is cash out today, for capacity that will be meaningfully utilised only as customer qualifications ramp over the next several years. During the build phase, the factory partially fills the denominator (asset base) without fully filling the numerator (revenue), so margins and FCF look depressed relative to the long-run picture. A DCF that applies today’s depressed margin to the full forecast period mis-times the recovery; a DCF that assumes an immediate margin jump without the corresponding capex is equally wrong in the other direction.
WACC: building the discount rate from the ground up
For a FCFF-based DCF, the discount rate is WACC — the weighted average cost of capital — which blends the cost of equity and the after-tax cost of debt in proportion to the company’s capital structure.
The cost of equity comes from CAPM — the capital asset pricing model:
Cost of equity = Risk-free rate + Beta × ERP
Each input has a specific source. The risk-free rate is the Singapore Government Securities 10-year bond yield — 2.1% at the time of modelling, representing the cost of capital with no credit risk. Beta measures how much the stock has historically moved relative to the market; Frencken’s 5-year monthly beta against the STI is 1.2, meaning it has moved roughly 20% more than the index in either direction — consistent with a cyclical industrial. The ERP — equity risk premium, the additional return investors demand for holding equities rather than risk-free bonds — I use at 6.0%, in line with practitioner consensus for a mature, open market.
CAPM gives a cost of equity of 2.1% + (1.2 × 6.0%) = 9.3%.
The cost of debt is simpler: Frencken’s borrowings carry a 5.0% pre-tax rate. After the corporate tax shield at a 21% rate, the after-tax cost of debt is 5.0% × (1 − 21%) = 3.95%.
Weighted by capital structure — 96.1% equity, 3.9% debt — the blended WACC is 9.1%.
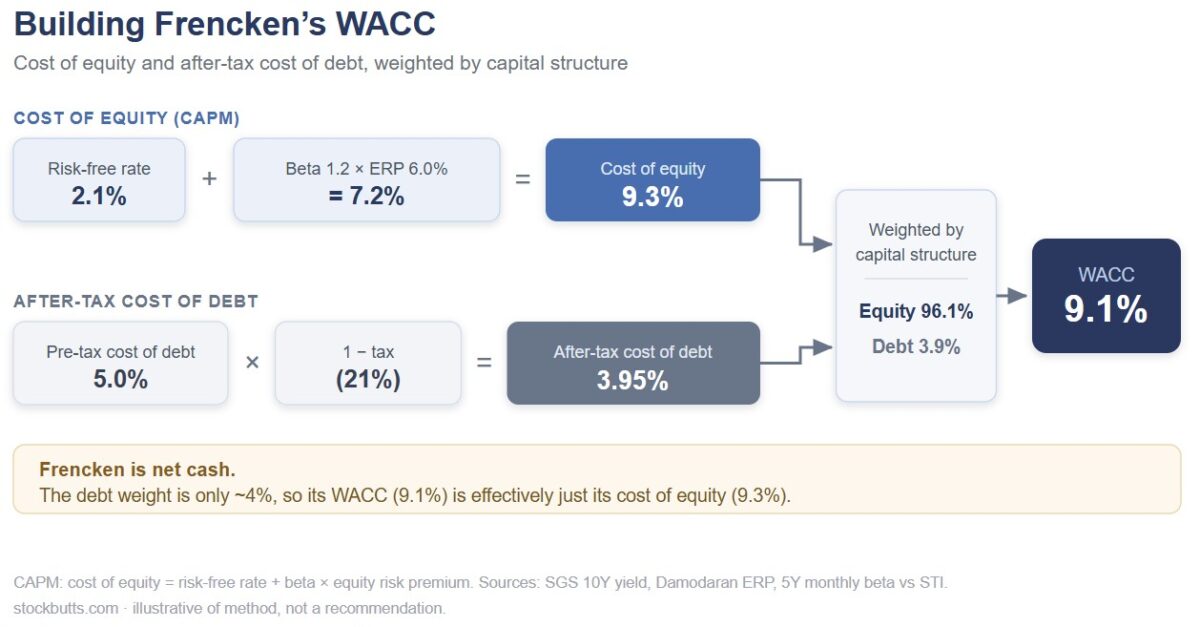
Caption: Because Frencken is net cash, the debt weight is a rounding error in the blend — WACC is approximately equal to the cost of equity.
Where qualitative facts enter: concentration and stickiness
Readers familiar with industrial investing will ask whether a manufacturer with deep, long-standing customer relationships ought to carry a lower discount rate than CAPM would suggest. My answer is disciplined: company-specific facts like customer concentration belong in the cash-flow assumptions and scenario range, not in a hand-tuned WACC.
Nudging WACC down by some informal “stickiness” discount produces a number that cannot be tested against anything — the kind of non-falsifiable fudge this site avoids. If Frencken’s customer relationships genuinely make it more resilient, that resilience shows up as more stable margins through a downcycle, higher supportable growth, or a narrower bear-case scenario — all checkable against history. For Frencken specifically, top-three Mechatronics customers exceed 50% of divisional revenue — a real switching cost built through years of process qualification — yet that same concentration amplified the FY2025 earnings impact when the European order book normalised. Concentration is not a clean rate-reducer; I reflect the durability in the base-case assumptions and leave CAPM’s arithmetic intact.
Terminal value: where most of the value, and most of the error, lives
A DCF operates over an explicit forecast period — typically five to ten years — plus a terminal value, the single figure that captures all the cash flows that follow. Terminal value is calculated via the Gordon Growth model:
TV = FCF_final × (1 + g) / (WACC − g)
…where g is the long-run growth rate assumed to continue in perpetuity. That terminal value is then discounted back to today alongside the explicit-period cash flows.
The critical anchor for g is long-run nominal GDP — a company cannot outgrow the economy forever. For a precision-engineering manufacturer, “forever” growth sits around 2.0–2.5%: Singapore’s long-run inflation runs around 2%, nominal GDP growth around 3.5–4%, placing 2.5% at the reasonable upper end. Assumptions that materially exceed this level require a specific structural explanation, not extrapolated optimism.
In the Frencken model, with WACC 9.1% and g 2.5%, the present value of the terminal value represents approximately 75% of total enterprise value (S$630.3m of the S$840.7m total EV).
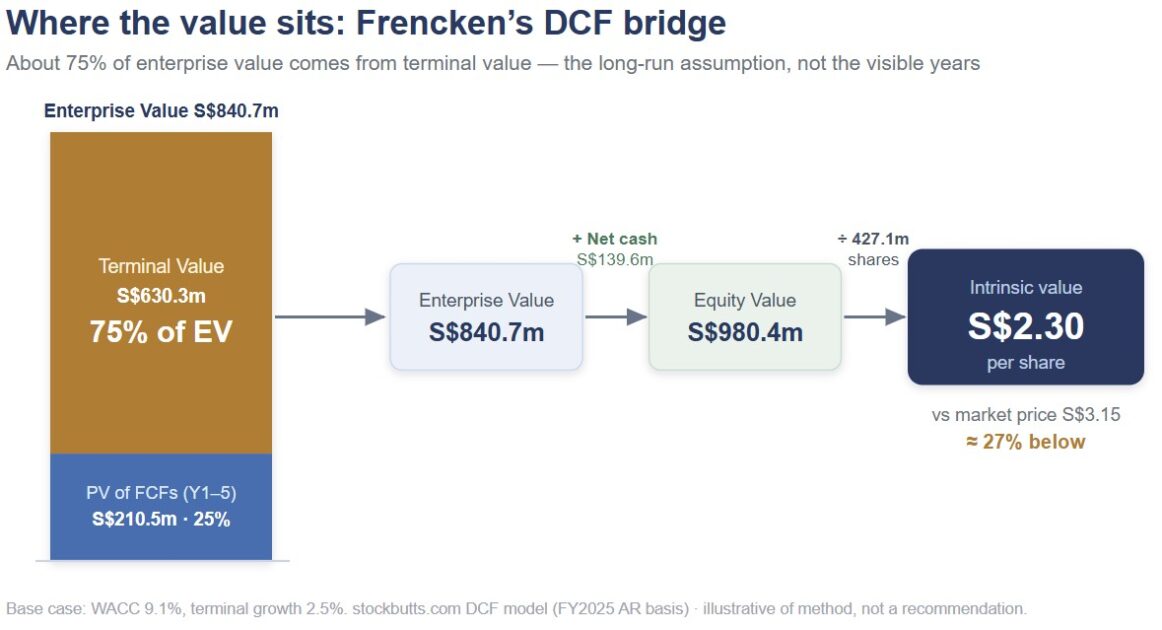
Caption: Three-quarters of Frencken’s modelled value comes from a single assumption about long-run growth — the terminal value dominates, and small moves in g or WACC swing the output hard.
The sensitivity table makes this concrete:
| Terminal growth rate | Implied value per share |
|---|---|
| 2.0% | S$2.21 |
| 2.5% | S$2.32 |
| 3.0% | S$2.46 |
A half-percentage-point move in g shifts per-share value by roughly S$0.10–0.15. To approach S$3.15 under this WACC, g must exceed 4% — the market would need to be treating a cyclical manufacturer like a company that will outgrow the economy for decades. Whether it is doing so deliberately or by default is precisely the question the reverse DCF answers.
Putting it together: the base-case DCF
With FCFF defined, WACC set, and terminal growth anchored, the bridge to equity value is:
Equity value = PV of explicit-period FCFs + PV of terminal value + Net cash
Note the addition: Frencken carries net cash of S$139.6m, so the equity is worth more than the enterprise value — the mirror image of a leveraged company where net debt is subtracted. Dividing by 427.1m shares gives the per-share figure.
Under conservative assumptions — Mechatronics growth of 8% in FY2026 stepping to 6% long-term, APS growth of 5–7%, an EBIT margin of 6.5%, and NWC intensity of 20% — the model produces a range of S$2.10–S$2.50, with a central estimate of S$2.30, approximately 27% below the 12 May 2026 reference close of S$3.15.
The output is always a range, never a point estimate. The S$2.10–2.50 band captures uncertainty across the growth path and the margin recovery trajectory; the terminal-value share (75%) means the overall valuation is primarily a long-run bet, and any scenario that assigns a materially different structural outlook will produce a correspondingly different number.
The reverse DCF: what the price is assuming
The base-case DCF answers the question “what do I think it is worth under my assumptions.” The reverse DCF flips the question: given the current market price and a fixed WACC, what must the market be assuming about growth and margins for that price to be justified?
This is the more useful exercise because it does not require the analyst to be right about the future — only to judge whether the market’s implied forecast is achievable — and those implied assumptions can be checked directly against the company’s own history.
For Frencken at S$3.15 and a WACC of 9.1%, the reverse DCF implies:
- Mechatronics revenue growth of approximately 10% in FY2026, accelerating to 12–13% in FY2028–29
- APS growth of 8–11%
- An EBIT margin of 8.0%
- NWC intensity of 15% (meaningfully tighter than the 20% base-case assumption)
Even with this aggressive combination of inputs, the model produces an implied equity value of S$3.08 — still 2.1% below the S$3.15 traded price. The market is pricing a scenario that, on this model structure and these WACC assumptions, the numbers cannot quite reach.
The APS growth line deserves particular scrutiny. The division contracted in revenue from FY2023 through FY2025; management has described FY2026 as a potential inflection point, driven by ADAS radar antenna work through the Gapwaves partnership, with production volumes expected to scale significantly from FY2028. The pillar lesson: a growth-jump assumption must be anchored to a specific customer ramp date — here, the Gapwaves production schedule — not to a category narrative about ADAS adoption.
This gap is the reverse DCF’s most powerful diagnostic. The inputs already used are the most aggressive Frencken’s history can support: 8.0% EBIT margin, reached exactly once (FY2021); 15% NWC intensity, well below the historical 20% norm. Even with both improvements arriving simultaneously, the model produces only S$3.08. Closing the remaining gap requires inputs beyond the demonstrated range — EBIT margins above 9%, or terminal growth above 4% — outcomes Frencken has not achieved. When the most aggressive realistic assumptions still cannot reach the traded price, the market has moved out of “historical possibility” and into blue-sky territory.
The disciplined check is to hold each implied assumption against Frencken’s demonstrated history. On EBIT margin: the company has operated in a range of 5.6–6.7% across FY2022–2025. The reverse DCF’s 8.0% has been reached exactly once in the observable record — in FY2021, in a distinct demand environment. For 8.0% to be the market’s base assumption, there would need to be a specific, identifiable structural reason for the step-change: a substantial mix shift toward higher-margin products, the Singapore cleanroom reaching full utilisation, a meaningful cost reduction from the FY2026 “alignment initiative” management has described, or the Mechatronics Asia team extending its design-to-prototype capability — having executed its first such programme for a leading European OEM in FY2025, a milestone that signals a potential move from build-to-print manufacturing into IP partnership. Each is a checkable mechanism; the burden of evidence is on the analyst who believes one or more has materialised. The first systemic test is the FY2026 interim result (due 13 August 2026): specifically, whether Mechatronics operating margin begins moving toward the upper end of the demonstrated range.
On NWC intensity: moving from the base-case 20% to the reverse DCF’s 15% while sustaining 10–13% revenue growth requires a structural improvement in working-capital management — shorter order cycles, better receivables terms. Possible, but not the default for a high-mix industrial.
The reverse DCF does not produce a verdict. The market’s implied case requires both the margin recovery and the NWC improvement simultaneously. A reader who believes it will happen needs to make the argument explicitly — which mechanism closes the margin gap, by when, and what would disconfirm it.
Five habits for valuing manufacturers
1. Run the reverse DCF first, then falsify the key driver
Before building a base-case DCF, solve for what the current price implies. Find the single most important input — for a manufacturer, almost always the EBIT margin — and compare it to the company’s own history. Frencken’s price requires 8.0%; the company has delivered 9.1% exactly once (FY2021) and has operated in a 5.6–6.7% range in the four years since. Demand a specific, named structural reason for the step-change — the Singapore cleanroom reaching full utilisation, a named cost programme with a tracked savings line — rather than a category-level tailwind.
2. Anchor assumptions to history, not hope
Use the demonstrated range of margins and growth as the base case; every assumption above it is a claim that something structural has changed, and claims need evidence. Present the output as a range — S$2.10–S$2.50, not S$2.30 — and let the width communicate the level of uncertainty in the inputs.
3. Anchor terminal growth to nominal GDP and watch the terminal-value share
If the reverse DCF shows g must exceed approximately 4% to justify the price, the market is pricing a cyclical manufacturer like a forever-growth software company. The higher the terminal value’s share of EV (75% for Frencken), the more the entire valuation rests on one long-run assumption — one no model can validate. Track the terminal-value share explicitly as a measure of how much weight the valuation places on the unknowable.
4. Do the NWC reality check
Never assume a manufacturer grows 10% in a year without a corresponding cash investment in working capital — roughly 15–20% of incremental revenue for a high-mix industrial. Read the inventory and receivables movement in the cash-flow statement: a drawdown can mean weakening demand, not efficiency. An OCF figure that looks strong in a declining-revenue year is more likely to be inventory release than a step-change in cash generation.
5. Track utilisation, not just margin
A low operating margin from a half-full new factory is a different story from structural inefficiency. Before treating depressed margins as permanent, check whether they are a J-curve timing effect. For Frencken, the S$63m Singapore facility is scheduled for completion in 1Q 2027, with production starting in 2H 2027 — making this a falsification window tied to a public milestone: if EBIT margins are not moving toward the 8% reverse-DCF level by early 2028, the J-curve thesis is being disconfirmed in real time. Look for leading indicators — revenue per unit of cleanroom capacity, divisional headcount versus output — rather than waiting for the margin to appear in the annual result.
Closing thought
The reverse DCF does not tell you to buy or sell. It tells you what you would have to believe for the current price to be justified, and it makes that belief falsifiable against the company’s own history. The believing — and the deciding — are yours.
This piece is the methodology reference for all future industrial coverage on this site. Frencken is the worked example because it makes every step auditable; for the full application — sensitivity table, bear-case, divisional dynamics — the published Frencken valuation has the detail.
Disclosure: At the time of writing, the author holds no position in Frencken Group (E28) — the company used as the worked example in this article — and has no plans to initiate one within the next 72 hours.
Disclaimer: This article reflects the author’s personal analysis and opinions, written in a strictly personal capacity. It is not financial advice and does not take into account any individual reader’s financial situation, investment objectives, or risk tolerance. Information is sourced from publicly available filings as of the date noted, but accuracy cannot be guaranteed. Readers should conduct their own research and consider consulting a licensed financial adviser before making any investment decisions. The author is not a licensed financial adviser under the Financial Advisers Act of Singapore.
Full disclaimer: stockbutts.com/disclaimer/
An ordinary man with extraordinary inspiration